
Interfaces & Impetuous Defaults
16 Feb 2023A little bit of a cryptic title but bear with me, this is a post about how when you build an interface, or any code really, you should consider the effect of your decisions.
Recently we ran into an interesting ingest issue when it came to pulling data from a Postgres database into our Data Lake at work. We currently use a nifty tool built using Scala and the fs2 library to write configuration driven ingests from SQL databases into our Data Lake. This works pretty well, we can configure the tool to write out into various formats (Avro, JSON, CSV) and into single or multiple “chunked” files. You simply provide it with some SQL to execute and the appropriate configuration and it will do its thing, writing to Amazon S3 (or even the local disk if you fancy), streaming the results of the query out to its destination.
We’ve used this tool on a multitude of different databases and tables. We’ve successfully ingested data from small Oracle tables to huge, multimillion row, DB2 tables. With a careful choice of the size of files (chunks) to write based on row width and the memory constraints of the JVM we are running in this works a treat. We even orchestrate these runs using Airflow and Docker containers for the JVM to sit inside.
Our interesting issue was that, regardless of our settings, we were running
into out of memory issues including the dreaded java.lang.OutOfMemoryError.
The dataset in question was only about 7,000,000 rows deep and not particularly
wide. We had also ingested data structured in the same way in our development
and production environments from other regions. However, this other region data
was orders of magnitudes smaller.
This ingest application has been specifically designed to be very easy to tune in terms of dealing with large datasets as mentioned above, so we began with some brute force attempts at solving the issue in the interest of saving engineering time. These large ingests would only happen sparingly, so committing extended thought to the issue was initially deemed unnecessary.
First, we tried to size up the container and available memory to the container. From the original measly 2 GB all the way up to 12 GB we ran into the same problems, what’s more these out of memory issues occurred very early on in the run, normally about a minute or so after the application does some basic counting of the rows in the table it is ingesting. More curiously it does not log or write anything before the failure. This is odd behaviour, as it is normally configured to log every minute with the amount of rows processed and an estimated time of completion. More so, if it is running into some kind of memory leak it would surely still have made some progress?
Given the lack of output, the next set of brute force attempts were to lower the count of rows being output in each file (chunk size). The way the chunking logic works is that it retains objects in memory before flushing them to the output. This is where many out of memory issues occur in wide tables: we set the row count too high for the count and complexity of columns, and end up hitting memory limits. As said previously, this is not a wide table, in fact, it’s less than 20 columns wide. Compared to other datasets this tool ingests, this is very small! We change it from about 12,000 rows per file (a number generated based on the tables size and amount of chunked files we want), to 1,000, run it and hit the same issue after the same amount of time. Still no logging, still no files written to S3. We tune it right down to 100 rows per file, still the same issue. I’ve peaked at the data in this table, it’s not complicated, in fact most text rows are limited to 20 characters, and there are no embedded objects, so we should easily be able to hold 100 rows in memory.
With this perplexing behaviour, I turn to debugging this issue locally. Having
avoided this so far due to the environment differences between my machine and
the Docker environment. Thankfully, this is a Scala application, and will run
anywhere with a Java 8+ Virtual Machine. I build the application locally, take
the configuration, and begin executing it. It hangs. The JVM won’t even respond
to my CTRL+C and polite kill commands, so I have to kill -9 it. I try again
with some differing row counts and run into the same issue. Then I LIMIT the
amount of rows to return in the actual query to some small amount. The
application works fine. I up the count to 1,000, it’s fine again. Now up to
10,000. It works, and it’s writing to multiple files as expected. Okay, that is
interesting. I up it to 100,000, it works again, albeit there is a pause
between getting the row count, logging and writing out the first file. In fact,
it’s taking a lot longer than it should given the chunking behaviour, in theory
time taken should only increase linearly with the total row count. I crank it
up to a 1,000,000 rows and it takes 5 minutes to begin writing files but its
working.
The next step is to use a profiler. VisualVM is a tool I am familiar with so I boot it up. I run a test with the smaller total count of rows and look at the heap graph:
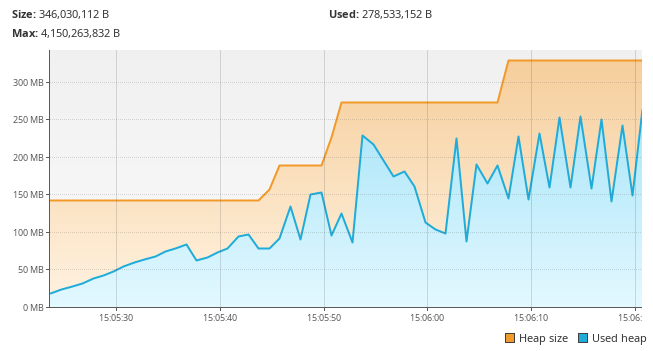
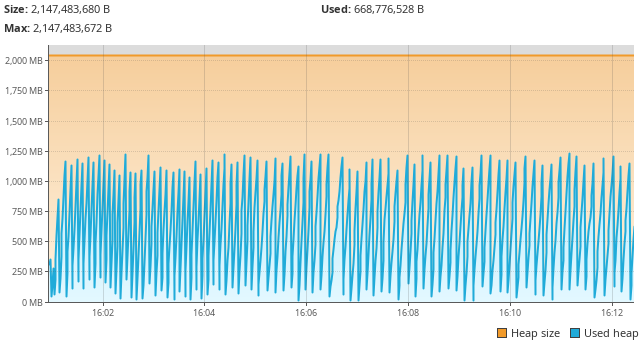
I then try with larger row counts:
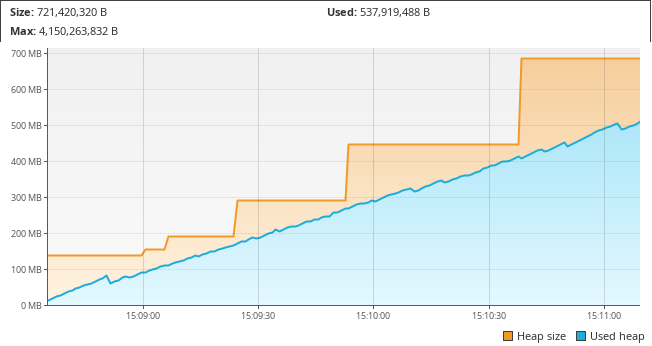
I’ve so far been running the application locally using a very simple java -cp
command, and have been omitting any kind of JVM parameters where it comes to
memory. That’s why you can see the resizing of the total heap space in those
graphs. So I opt to set both the minimum and maximum heap space to be about
2G. The following graphs include these parameters, as you can see from the
fixed heap size line.
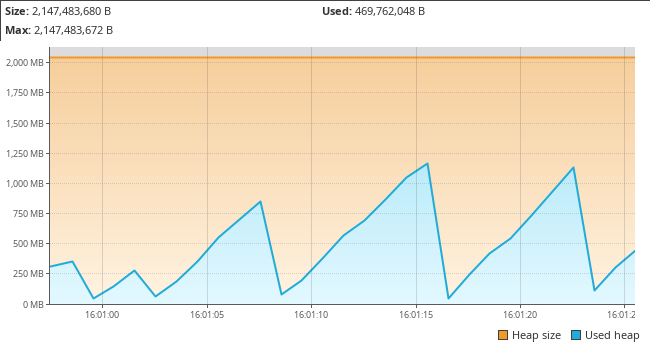
With the described chunking behaviour, a sawtooth pattern is expected: We
collect the rows to write out in a file, write them, then they are garbage
collected and we repeat. With the right set of rows per file (chunk size) this
sawtooth should stay roughly the same size. But with the 1,000,000 total row
LIMIT run it just climbs astronomically at the start.
At this stage, 2 unconnected points colleagues made surface to my thoughts. The first is that this is the first large Postgres table we have been ingesting, and that the driver being used is slightly old. The second was a misunderstanding in the way the application worked, a colleague unfamiliar with it mentioned in passing that loading a whole table that large all at once would require a lot of memory. In order to understand why these 2 points are important we need to think about how a Java/Scala application communicates with SQL databases.
The Java Database Connectivity (JDBC) API, is a common interface for allowing Java based application to connect to SQL databases. Your basic Java code remains mostly the same for connecting between the myriad of different databases that exist when using it. This ingest application uses JDBC. It can connect to basically any JDBC friendly database by using their vendor given JDBC driver. In this case that would be Postgres.
I’m very familiar with JDBC, I’ve used it directly many times when working on Big Data applications whilst working as a Big Data Engineer, and used it indirectly via JPA (Java Persistence API) as a Full Stack Developer. It can be tuned in a lot of ways to cater for the different kinds of queries you want to make. One of the key features that can be tuned is how JDBC fetches the results of a query.
Retrieving the results of a query using JDBC, at the basic level, involves
creating a Connection object that represents your connection to the database,
and then creating Statement objects for executing your queries. These
Statement (or PreparedStatement) objects return your query results via an
object called a ResultSet. The ResultSet represents a view into the results
of your query. Implementation is driver specific, but, in most
cases, it represents a cursor into the database; calls made to it retrieve
results of your query over the wire from the database.
Obviously, you don’t want to be performing some kind of network operation for
every row in your ResultSet as you’d be incurring a lot of overhead, so a
common hint you can provide to a Statement is the fetchSize. This hint,
tells the JDBC client the desired number of rows you’d like to fetch with each
network request to the database. By default, this is set to a value of 0, which
leaves the exact number of results up to the database and JDBC client
implementation. This works great in most cases; implementations can use all
sorts of heuristics to decide on a sensible value based on the queries being
made, the tables being accessed, and columns being returned. Or they can just
choose some default behaviour that works in a large majority of situations, for
example: fetching up to 100 rows at a time, or fetching all the rows and
building a simple ResultSet that is essentially an interface over an array.
The latter is Postgres’ default behaviour. It works really well, for small
queries, but for larger ones it will fill up the JVM heap space quickly. This
is what is happening in the problematic ingest! It’s why the smaller ingests
did not fail, their total results fit in memory. It’s why the larger
ingests take so long before they start writing, they’re filling up whatever
lays behind the ResultSet interface!
With this revelation, I search through our codebase for where we create our
Statement object and configure it. I see we already have the ability to set
the fetchSize in the code, but it’s only ever given the value 0. With a quick
edit, I give the value a configuration option and set it in my test
configuration to a size that matches the rows per file count and kick it off.
Disaster, nothing has changed. The application still behaves the same way. I do a quick search, stumble across a StackOverflow question and answer that seems related and open the reference to the Postgres documentation. There it is, written in plain English:
By default the driver collects all the results for the query at once. This can be inconvenient for large data sets so the JDBC driver provides a means of basing a
ResultSeton a database cursor and only fetching a small number of rows.
Further on, are some bullet points explaining how to make the Postgres JDBC client use a cursor:
- You need to make sure your
Connectionhasautocommitturned off. - Your
Statementmust create aResultSetof the typeResultSet.TYPE_FORWARD_ONLY - The query must be a single statement.
The ResultSet is configured correctly, but the Connection is created with
autocommit turned on. There’s no reason it even needs to commit anything at
all however, as the ResultSet objects are also configured to be read only,
and this tool is only designed to query not update the target databases. So I
turn autocommit off (but I do manually handle commit/rollback logic to ensure
there are no future issues).
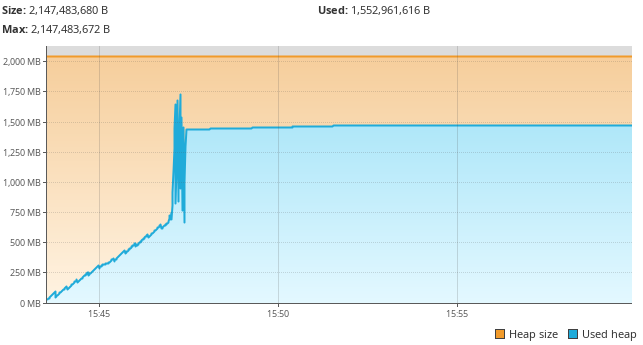
Now I run my same configuration again and the results are positive:
That’s much better! The application’s memory usage is behaving as expected! With these changes done, a merge request is made and within the hour the large dataset is loading as expected.
Now the main lesson here is to be aware of the defaults of the implementation of the interfaces you are using. The takeaway is also that you should be mindful of what your defaults are when creating an application and how they will effect your users. If a default will have significant impact in some situations, you want to make this very clear in documentation, but perhaps also during runtime with some warnings to the user.
JDBC tuning is a prime example where the defaults of various systems can lead to all sorts of interesting situations that require you to pay attention to the design decisions people have made, but these situations crop up everywhere. Way back in 2007 Joshua Bloch gave an excellent talk with suggestion on how to design a good API and why it matters that I recommend all developers watch.

Comments